Procurement of paddy and wheat highest ever in 2020-21
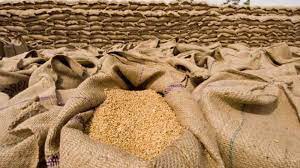
The Union Minister of State for Consumer Affairs, Food and Public Distribution, Ms. SadhviNiranjanJyoti in a written reply to a question in Rajya Sabha today informed that Government of India has procured 869.29 LMT of paddy during KMS 2020-21 and 433.32 LMT of wheat during RMS 2021-22, which is the highest ever procurement.
Some state governments have also recorded highest ever procurement of foodgrains during current year.
Wheat: Punjab, Uttar Pradesh, Rajasthan, Uttrakhand, Gujarat, Himachal Pradesh and Jammu & Kashmir have recorded highest ever procurement during RMS 2021-22.
Paddy: Punjab, Bihar, Gujarat, Telangana, Jharkhand, Kerala, Madhya Pradesh, Odisha, Tamil Nadu, Uttrakhand and Uttar Pradesh have recorded highest ever procurement during KMS 2020-21.
Coarsegrain: The State Government of Gujarat, Haryana, Karnataka, Madhya Pradesh, Maharashtra and Uttar Pradesh have recorded highest procurement during 2020-21 as compared to procurement during last five years.
| PROCUREMENT OF WHEAT AND VALUE AT MSP | ||||||||
| Procurement figures are in LMT , Rs in Crore (as on 20.07.2021) | ||||||||
| SL No | STATES/ UTs | RMS 2019-20 | RMS 2020-21 | RMS 2021-22 | ||||
| Procurement | MSP Value (Rs 1840/Qtl) | Procurement | MSP Value (Rs 1925/Qtl) | Procurement | MSP (Rs 1975/Qtl) | |||
| 1 | Punjab | 129.12 | 23758.08 | 127.14 | 24474.45 | 132.10 | 26089.75 | |
| 2 | Haryana | 93.20 | 17148.80 | 74.00 | 14245.00 | 84.93 | 16773.68 | |
| 3 | Uttar Pradesh | 37.00 | 6808.00 | 35.77 | 6885.73 | 56.41 | 11140.98 | |
| 4 | Madhya Pradesh | 67.25 | 12374.00 | 129.42 | 24913.35 | 128.16 | 25311.60 | |
| 5 | Bihar | 0.03 | 5.52 | 0.05 | 9.63 | 4.56 | 900.60 | |
| 6 | Rajasthan | 14.11 | 2596.24 | 22.25 | 4283.13 | 23.40 | 4621.50 | |
| 7 | Uttrakhand | 0.42 | 77.28 | 0.38 | 73.15 | 1.44 | 284.40 | |
| 8 | Chandigarh | 0.13 | 23.92 | 0.11 | 21.18 | 0.17 | 33.58 | |
| 9 | Delhi | 0.00 | 0.00 | 0.00 | 0.00 | 0.06 | 11.85 | |
| 10 | Gujarat | 0.05 | 9.20 | 0.77 | 148.23 | 1.71 | 337.73 | |
| 11 | Jharkhand | 0.00 | 0.00 | 0.00 | 0.00 | 0.00 | 0.00 | |
| 12 | Maharashtra | 0.00 | 0.00 | 0.00 | 0.00 | 0.01 | 1.98 | |
| 13 | Himachal Pradesh | 0.01 | 1.84 | 0.03 | 5.78 | 0.13 | 25.68 | |
| 14 | Jammu & Kashmir | 0.00 | 0.00 | 0.00 | 0.00 | 0.24 | 47.40 | |
| 15 | West Bengal | 0.00 | 0.00 | 0.00 | 0.00 | 0.00 | 0.00 | |
| TOTAL | 341.32 | 62802.88 | 389.92 | 75059.60 | 433.32 | 85580.70 | ||
| STATEMENT SHOWING STATE WISE PADDY PROCUREMENT & VALUE AT MSP | ||||||
| Procurement Fig. in LMT , MSP in Rs. Crores (as on 20.07.2021) | ||||||
| STATES | KMS 2019-20 | KMS 2020-21 | KMS 2021-22 | |||
| Procurement | MSP Value (Rs 1835/Qtl) | Procurement | MSP Value (Rs 1888/Qtl) | Procurement | MSP Value (Rs 1960/Qtl) | |
| ANDHRA PRADESH | 82.58 | 15153.43 | 82.60 | 15594.88 | NIL | |
| TELANGANA | 111.26 | 20416.21 | 141.01 | 26622.69 | ||
| ASSAM | 3.15 | 578.03 | 1.88 | 354.94 | ||
| BIHAR | 20.02 | 3673.67 | 35.59 | 6719.39 | ||
| CHANDIGARH | 0.22 | 40.37 | 0.28 | 52.86 | ||
| CHHATISGARH | 74.86 | 13736.81 | 59.35 | 11205.28 | ||
| GUJARAT | 0.21 | 38.54 | 1.10 | 207.68 | ||
| HARYANA | 64.28 | 11795.38 | 56.55 | 10676.64 | ||
| HIMACHAL PRADESH | 0.00 | 0.00 | 0.00 | 0.00 | ||
| JHARKHAND | 3.80 | 697.30 | 6.28 | 1185.66 | ||
| JAMMU & KASHMIR | 0.15 | 27.53 | 0.38 | 71.74 | ||
| KARNATAKA | 0.61 | 111.94 | 2.06 | 388.93 | ||
| KERALA | 7.10 | 1302.85 | 7.65 | 1444.32 | ||
| MADHYA PRADESH | 25.97 | 4765.50 | 37.27 | 7036.58 | ||
| MAHARASHTRA | 17.42 | 3196.57 | 18.19 | 3434.27 | ||
| ODISHA | 70.57 | 12949.60 | 77.38 | 14609.34 | ||
| PUNJAB | 162.33 | 29787.56 | 202.82 | 38292.42 | ||
| NEF (Tripura) | 0.21 | 38.54 | 0.22 | 41.54 | ||
| TAMIL NADU | 32.41 | 5947.24 | 37.93 | 7161.18 | ||
| UTTAR PRADESH | 56.57 | 10380.60 | 66.84 | 12619.39 | ||
| UTTRAKHAND | 10.18 | 1868.03 | 10.62 | 2005.06 | ||
| WEST BENGAL | 27.03 | 4960.01 | 23.29 | 4397.15 | ||
| TOTAL | 770.93 | 141465.66 | 869.29 | 164121.95 | ||
| PROCUREMENT OF COARSEGRAINS AND VALUE AT MSP | ||||||||||
| As on 20.07.2021 | ||||||||||
| KMS | COMMODITY | GUJARAT | HARYANA | KARNATAKA | MADHYA PRADESH | MAHARASHTRA | UTTAR PRADESH | TOTAL PROCUREMENT (In MT) | MSP Value (Rs. In Lakh) | |
| 2019-20 | JOWAR (Kharif) | 0 | 0 | 838 | 5469 | 1468 | 0 | 7775 | 1998 | |
| JOWAR (Rabi) | 0 | 0 | 8418 | 0 | 7145 | 0 | 15563 | 4000 | ||
| BAJRA | 0 | 100000 | 0 | 76 | 0 | 0 | 100076 | 20015 | ||
| MAIZE (Kharif) | 0 | 0 | 0 | 0 | 19 | 25 | 44 | 8 | ||
| MAIZE (Rabi) | 0 | 0 | 0 | 0 | 115094 | 0 | 115094 | 20257 | ||
| RAGI | 0 | 0 | 193243 | 0 | 0 | 0 | 193243 | 60872 | ||
| Total | 0 | 100000 | 202499 | 5545 | 123726 | 25 | 431795 | 107149 | ||
| 2020-21 | JOWAR(Kharif) | 0 | 0 | 80722 | 29582 | 17784 | 0 | 128088 | 33815 | |
| JOWAR(Rabi) | 0 | 0 | 0 | 0 | 7696 | 0 | 7696 | 2032 | ||
| BAJRA | 11515 | 150000 | 0 | 195351 | 5005 | 0 | 361871 | 77802 | ||
| MAIZE(Kharif) | 4133 | 0 | 0 | 0 | 88283 | 106413 | 198829 | 36783 | ||
| MAIZE(Rabi) | 0 | 0 | 0 | 0 | 6199 | 0 | 6199 | 1147 | ||
| RAGI | 0 | 0 | 474098 | 0 | 0 | 0 | 474098 | 156215 | ||
| Total | 15648 | 150000 | 554820 | 224933 | 124967 | 106413 | 1176781 | 307795 | ||
| 2021-22 | Nil | |||||||||
| Procurement of Pulses under Price Stabilisation Fund (PSF)Scheme(as on 22.07.2021) | ||||
| Year | Pulses | STATE | QUANTITY PROCURED (IN MT) | VALUE (IN Rs. CRORE) |
| 2019-20 | Tur Kharif 2019 | Telangana | 88,281.14 | 512.03 |
| Karnataka | 77,196.75 | 447.74 | ||
| Andhra Pradesh | 11,085.05 | 64.29 | ||
| Gujarat | 6,132.64 | 35.57 | ||
| Total | 1,82,695.57 | 1,059.63 | ||
| Masoor Rabi 2020 | Madhya Pradesh | 92.97 | 0.50 | |
| Total | 92.97 | 0.50 | ||
| 2021-22 | Masoor Rabi 2021 | Madhya Pradesh | 15,323.61 | 95.41 |
| Uttar Pradesh | 7,064.69 | 43.77 | ||
| Bihar | 47.48 | 0.32 | ||
| West Bengal | 122.00 | 0.80 | ||
| Total | 22,557.77 | 140.30 | ||
| Moong Rabi 2021 | Madhya Pradesh | 63,824.75 | 459.28 | |
| Total | 63,824.75 | 459.28 | ||
| Source: Department of Consumer Affairs | ||||

