
INDIA’S MERCHANDISE TRADE: Preliminary Data October 2021

India’s merchandise imports in October 2021 was USD 55.37 billion, an increase of 62.49% over USD 34.07 billion in October 2020 and an increase of 45.76% over USD 37.99 billion in October 2019.
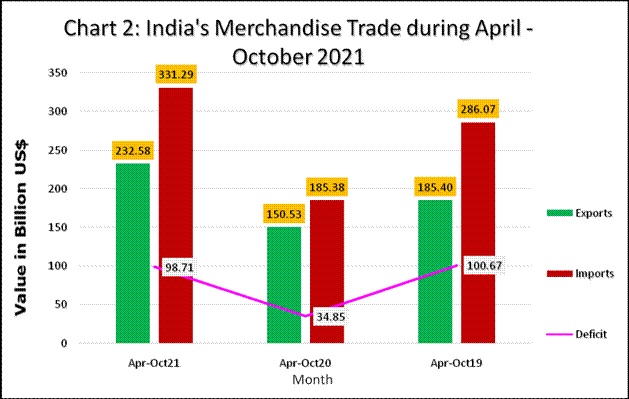
India’s merchandise imports in April-October 2021 was USD 331.29 billion, an increase of 78.71% over USD 185.38 billion in April-October 2020 and an increase of 15.81% over USD 286.07 billion in April-October 2019.
The trade deficit in October 2021 was USD 19.9 billion, while it was USD 98.71 billion during April-October 2021.
| Statement 1: India’s Merchandise Trade in October 2021 | |||||
| Value in Billion USD | % Growth | ||||
| Oct-21 | Oct-20 | Oct-19 | Oct-21 over Oct-20 | Oct-21 over Oct-19 | |
| Exports | 35.47 | 24.92 | 26.23 | 42.33 | 35.21 |
| Imports | 55.37 | 34.07 | 37.99 | 62.49 | 45.76 |
| Deficit | 19.90 | 9.15 | 11.75 | 117.38 | 69.29 |
| Statement 2: India’s Merchandise Trade in Apr-Oct 2021 | |||||
| Value in Billion USD | % Growth | ||||
| Apr-Oct21 | Apr-Oct20 | Apr-Oct19 | Apr-Oct 21 over Apr-Oct 20 | Apr-Oct 21 over Apr-Oct 19 | |
| Exports | 232.58 | 150.53 | 185.40 | 54.51 | 25.45 |
| Imports | 331.29 | 185.38 | 286.07 | 78.71 | 15.81 |
| Deficit | 98.71 | 34.85 | 100.67 | 183.22 | -1.95 |

Value of non-petroleum exports in October 2021 was 30.27 USD billion, registering a positive growth of 29.63% over non-petroleum exports of USD 23.35 billion in October 2020 and a positive growth of 32.84% over non-petroleum exports of USD 22.79 billion in October 2019.
Value of non-petroleum imports was USD 40.94 billion in October 2021 with a positive growth of 45.82% over non-petroleum imports of USD 28.07 billion in October 2020 and a positive growth of 44.87% over non-petroleum imports of USD 28.26 billion in October 2019.
| Statement 3: Merchandise Non-POL Trade in October 2021 | |||||
| Value in Billion USD | % Growth | ||||
| Oct21 | Oct20 | Oct19 | Oct21 over Oct20 | Oct21 over Oct19 | |
| Exports | 30.27 | 23.35 | 22.79 | 29.63 | 32.84 |
| Imports | 40.94 | 28.07 | 28.26 | 45.82 | 44.87 |
The cumulative value of non-petroleum exports in April-October 2021 was USD 199.41 billion, an increase of 45.59% over USD 136.96 billion in April-October 2020 and an increase of 24.09% over USD 160.7 billion in April-October 2019.
The cumulative value of non-petroleum imports in April-October 2021 was USD 243.89 billion, showing an increase of 65.41% compared to non-oil imports of USD 147.44 billion in April-October 2020 and an increase of 15.51% compared to non-oil imports of USD 211.14 billion in April-October 2019.
| Statement 4: Merchandise Non-POL Trade Apr-Oct 2021 | |||||
| Value in Billion USD | % Growth | ||||
| Apr-Oct21 | Apr-Oct20 | Apr-Oct19 | Apr-Oct21 over Apr-Oct20 | Apr-Oct21 over Apr-Oct19 | |
| Exports | 199.41 | 136.96 | 160.70 | 45.59 | 24.09 |
| Imports | 243.89 | 147.44 | 211.14 | 65.41 | 15.51 |
Value of non-petroleum and non-gems and jewellery exports in October 2021 was USD 26.05 billion, registering a positive growth of 27.54% over non-petroleum and non-gems and jewellery exports of USD 20.43 billion in October 2020 and a positive growth of 36.59% over non-petroleum and non-gems and jewellery exports of USD 19.07 billion in October 2019.
Value of non-oil, non-GJ (gold, silver & Precious metals) imports was USD 32.42 billion in October 2021 with a positive growth of 39.29% over non-oil and non-GJ imports of USD 23.27 billion in October 2020 and a positive growth of 30.72% over non-oil and non-GJ imports of USD 24.8 billion in October 2019.
| Statement 5: Merchandise Non-POL Non-GJ Trade in October 2021 | |||||
| Value in Billion USD | % Growth | ||||
| Oct-21 | Oct-20 | Oct-19 | Oct21 over Oct20 | Oct21 over Oct19 | |
| Exports | 26.05 | 20.43 | 19.07 | 27.54 | 36.59 |
| Imports | 32.42 | 23.27 | 24.80 | 39.29 | 30.72 |
The cumulative value of non-petroleum and non-gems and jewellery exports in April-October 2021 was USD 175.89 billion, an increase of 40.33% over cumulative value of non-petroleum and non-gems and jewellery exports of USD 125.35 billion in April-October 2020 and an increase of 27.72% over cumulative value of non-petroleum and non-gems and jewellery exports of USD 137.72 billion in April-October 2019.
Non-oil, non-GJ (Gold, Silver & Precious Metals) imports was USD 196.07 billion in April-October 2021, recording a positive growth of 50.91%, as compared to non-oil and non-GJ imports of USD 129.92 billion in April-October 2020 and a marginal positive growth of 9.87% over USD 178.45 billion in April-October 2019.
| Statement 6: Merchandise Non-POL Non-GJ Trade Apr-Oct 2021 | |||||
| Value in Billion USD | % Growth | ||||
| Apr-Oct 21 | Apr-Oct 20 | Apr-Oct 19 | Apr-Oct 21 over Apr-Oct 20 | Apr-Oct 21 over Apr-Oct 19 | |
| Exports | 175.89 | 125.35 | 137.72 | 40.33 | 27.72 |
| Imports | 196.07 | 129.92 | 178.45 | 50.91 | 9.87 |
Top 10 major commodity groups, covering more than 80% of total exports, have shown positive growth in October 2021 over corresponding month of previous year, as stated below.
| Statement 7: Exports of Top 10 Major Commodity Groups | ||||
| Value of Export (Million US$) | Share (%) | Growth (%) | ||
| Major Commodity Group | Oct ’21 | Oct ’20 | Oct ’21 | Oct ’21 over Oct ’20 |
| Engineering Goods | 9388.28 | 6229.91 | 28.19 | 50.70 |
| Petroleum Products | 5197.59 | 1567.31 | 14.69 | 231.63 |
| Gems And Jewellery | 4221.73 | 2926.82 | 9.67 | 44.24 |
| Organic And Inorganic Chemicals | 2569.28 | 1810.71 | 7.11 | 41.89 |
| Drugs And Pharmaceuticals | 2060.09 | 2078.92 | 6.14 | -0.91 |
| Electronic Goods | 1347.93 | 966.29 | 3.91 | 39.50 |
| Cotton Yarn/Fabrics/Made-ups Handloom Products Etc. | 1332.75 | 912.34 | 3.89 | 46.08 |
| RMG Of All Textiles | 1252.90 | 1177.56 | 3.50 | 6.40 |
| Marine Products | 807.80 | 684.06 | 2.28 | 18.09 |
| Plastic And Linoleum | 781.49 | 599.55 | 2.25 | 30.35 |
| Total of 10 Major Commodity Groups | 28959.84 | 18953.48 | 81.62 | 52.79 |
| Rest | 6510.45 | 5966.93 | 18.38 | 9.11 |
| Total Exports | 35470.29 | 24920.41 | 100.00 | 42.33 |
Top 10 major commodity groups, covering about 78% of total imports, have shown below.
| Statement 8: Imports of Top 10 Major Commodity Groups | ||||
| Import (Million US$) | Share (%) | Growth (%) | ||
| Major Commodity Group | Oct.’21 | Oct.’20 | Oct.’21 | Oct.’21 over Oct.’20 |
| Petroleum, Crude & products | 14430.76 | 6000.27 | 26.06 | 140.50 |
| Electronic goods | 6811.03 | 5533.73 | 12.30 | 23.08 |
| Gold | 5106.14 | 2499.97 | 9.22 | 104.25 |
| Machinery, electrical & non-electrical | 3540.77 | 2497.29 | 6.39 | 41.78 |
| Coal, Coke & Briquettes, etc. | 3311.93 | 1512.88 | 5.98 | 118.92 |
| Organic & Inorganic Chemicals | 2620.62 | 1563.23 | 4.73 | 67.64 |
| Pearls, precious & Semi-precious stones | 2483.01 | 2291.40 | 4.48 | 8.36 |
| Artificial resins, plastic materials, etc. | 1727.27 | 1121.06 | 3.12 | 54.07 |
| Vegetable Oil | 1624.79 | 1018.08 | 2.93 | 59.59 |
| Iron & Steel | 1444.81 | 985.71 | 2.61 | 46.58 |
| Total of 10 Major Commodity Groups | 43101.12 | 25023.62 | 77.84 | 72.24 |
| Rest | 12266.92 | 9050.21 | 22.16 | 35.54 |
| Total Imports | 55368.04 | 34073.84 | 100.00 | 62.49 |